
Senior Data Scientist
Contact VP
There are multiple approaches to estimating relatedness between samples, including genome-wide measures and methods that rely on identity by descent (IBD) segment detection. Analyzing results from genome-wide SNP-based kinship analysis or comparing analyses to simulated data for benchmarking have to this point required writing one-off analysis functions or utility scripts that are seldom distributed with robust documentation, test suites, or narrative examples of usage. There is a need in the field for a well-documented software package with a consistent design and application programming interface (API) that contains functions to assist with downstream manipulation, benchmarking, and analysis of SNP-based kinship assessment methods.
To address this problem, Signature Science developed the skater R package for SNP-based kinship analysis, testing, and evaluation with R. The skater package provides an intuitive collection of analysis and utility functions for SNP-based kinship analysis. Functions in the package include tools for importing, parsing, and analyzing pedigree data, performing relationship degree inference, benchmarking relationship degree classification, and summarizing IBD segment data. The package adheres to “tidy” data analysis principles and builds upon the widely used tidyverse R ecosystem.
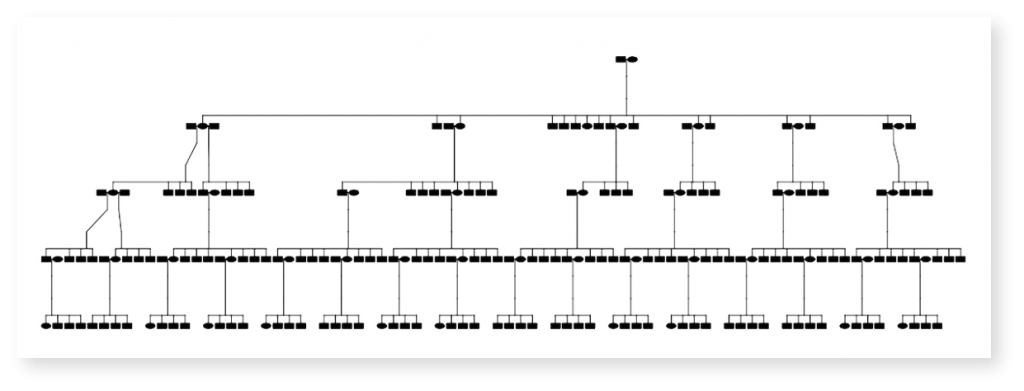
Signature Science used the skater package extensively in our analysis evaluating the impact of dropout and genotyping error, common in forensic samples, on genome-wide relatedness and IBD segment approaches. First, we simulated thousands of relationships in deep multigenerational pedigrees where the underlying truth relationship was known. The skater package facilitates data management and visualization of these pedigrees, as shown below.
Simulation Pedigree Visualized in skater
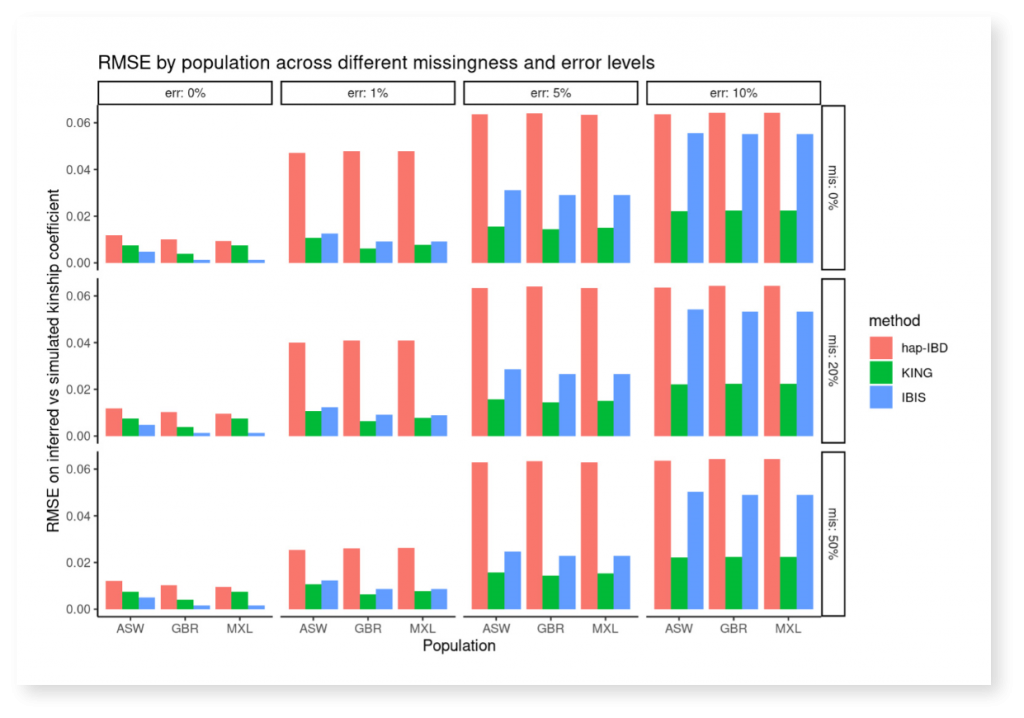
After simulating multiple pedigrees with varying levels of genotyping error (“err”) and missingness levels (“mis”), we next used the skater package to calculate kinship coefficients from known IBD segments, and compare true relationships against the detected kinship coefficient, benchmarking using the root mean square error (RMSE). With information obtained by using the skater package we created the figure below illustrating how one approach (KING, in green) had lower error than others as genotyping error increased.
RMSE by Population Across Different Missingness and Error Levels
The skater package is implemented as an R package and is available on the Comprehensive R Archive Network (CRAN). The skater package is freely available, open source, and permissively licensed.
Publications
Tools
Want more information about skater?